Devices to store electrical energy - electric batteries - are an important part of many modern electrical systems. They are used in electric vehicles, are an important part of vehicle systems with internal combustion engines, are used as part of electric systems with generation through renewable energy sources, etc.
Thus, the electric battery model is one of the basic models components of various devices, systems and installations and is already part of REPIT software library. This article is aimed at description and verification of this model and structurally includes the following main parts:
-
Description of the mathematical expressions underlying the model;
-
Verification of calculation results in steady-state mode by comparing with the passport specifications of Panasonic NCR-18650B lithium-ion battery;
-
Verification of calculation results in dynamics by comparing with studies in [1].
Introduction to model structure and mathematical expressions
A lithium-ion battery model is implemented in REPIT software. The discharge of such battery is described by formula (1):

This model represents quite accurately the output voltage dynamics when the battery current changes and takes into account the battery no-load voltage through the battery voltage constant and the polarization voltage summand [1].
The battery charging is described by formula (2):

In these formulas:
 – battery voltage constant (V)
 – polarization constant (
 );
);
 – battery capacity (
 );
);
 – actual battery charge ();
 – exponential area amplitude (V);
 – inverse time constant of exponential area (
 );
);
 – internal resistance (Ohm);
 – battery current (A);
 – filtered battery current (A).
This formula allows accounting the jump in battery voltage when full charge is reached through the polarization resistance summand.
Verification of steady-state calculations based on data sheet specifications
Data from Panasonic NCR-18650B battery discharge data sheet specifications [2] were used to verify the steady-state lithium-ion battery model.
In order to compare discharge characteristics of the battery at two discharge current values: equal to the capacity current ( ), and equal to twice the capacity current (
 ) were calculated in REPIT software.
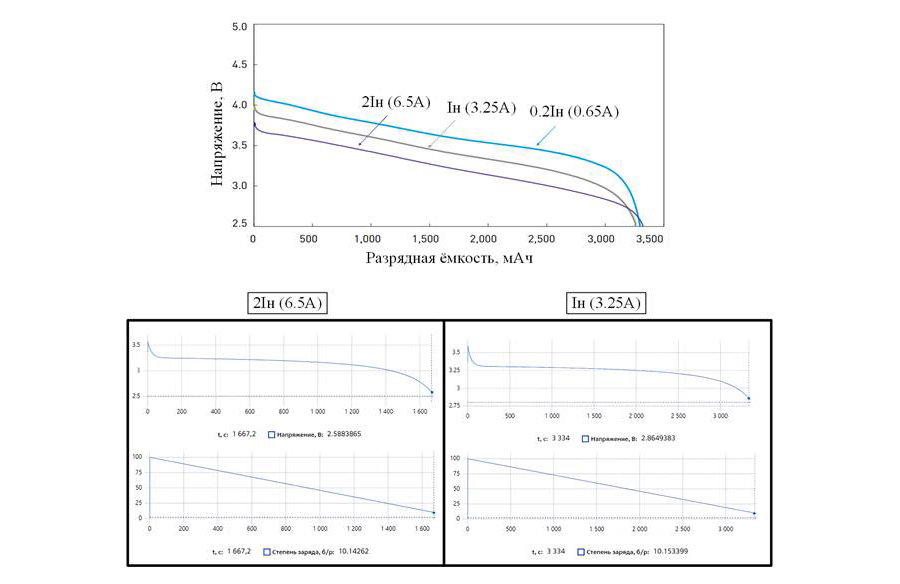
It is necessary to note that the passport curves were created as a relationship between the battery output voltage and the capacity used to discharge the battery, while the curves from REPIT software show the battery charge and voltage as separate diagrams.
The above mentioned specifications are given in Figure 1.
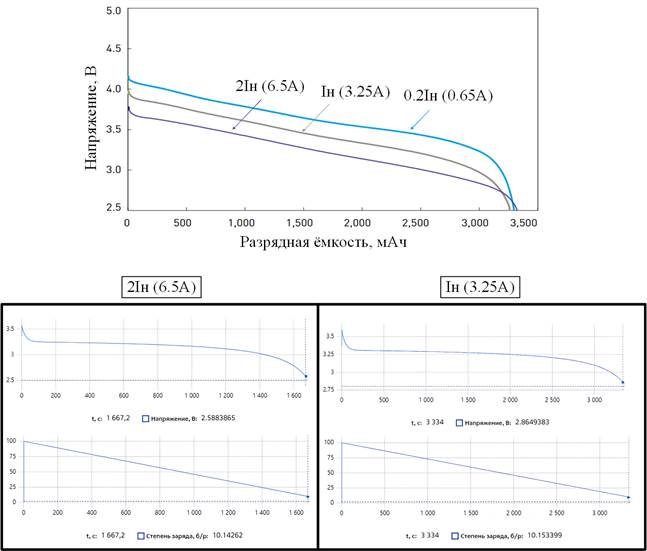
Figure 1 – Discharge characteristics of Panasonic NCR-18650B battery, obtained from the data sheet (upper diagram) and through calculation in REPIT software
|
Напряжение, В |
Voltage, V |
|
Разрядная ёмкость, мАч |
Discharge capacity, mAh |
|
А |
A |
|
Степень заряда б/р |
Degree of battery charge |
The model parameters are given in Table 1.
Table 1. Parameters of lithium-ion battery model in REPIT software
|
|
|
|
|
|
|
V |
Ohm |
|
V |
|
|
3.3660 |
0.0100 |
0.0076 |
0.2642 |
26.5487 |


Comparing the obtained models, it can be noted the similarity of curve changes and range of changes in their values. At the same time, it is necessary to note high values of initial voltages at data sheet specifications and their sharper curvature when approaching full discharge. At the same time, despite small deviations in values, both the data sheet and the model converge to 2.5 V as the battery approaches full discharge.
Verification of calculations in dynamics based on similar studies
The experiment described in [2] was simulated to assess the obtained model as the dynamic response. The current load of the battery was changed in steps, discharging and charging the battery. The current varied from 2.8 A (battery discharge) to -2.8 A (battery charge), repeating periodically for 9000 s. Only a part of the current variation curve in the range from 0 to 2000 s was considered for verification.
The battery current load curve is given in Figure 2, the battery charge level curve is given in Figure 3, and the output voltage curve is given in Figure 4. The results obtained by the author of the article [1] are given in Figure 5.
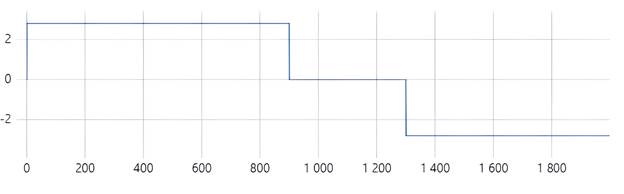
Figure 2 – Diagram of current change, in A, in time, in s
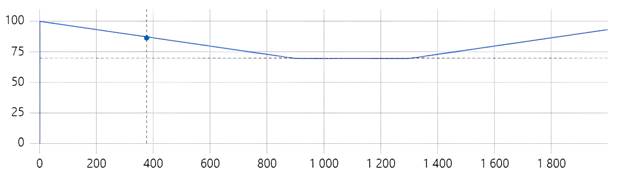
Figure 3 – Curve of battery charge level variation, in %, in time, in s
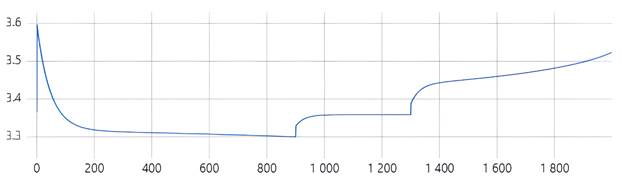
Figure 4 – Variation curve of the battery output voltage, in V, in time, in s
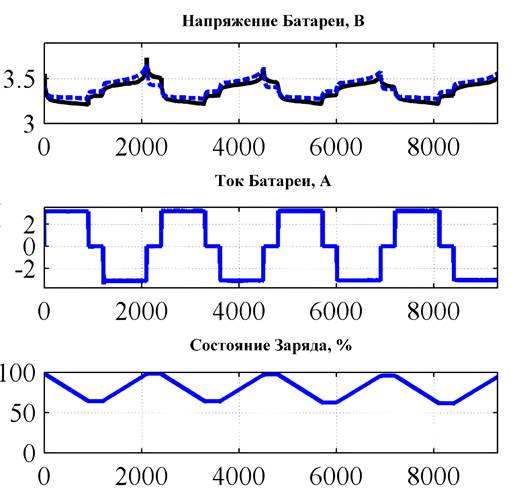
Figure 5 – Curves of parameters variation of the battery model in the verification article
|
Напряжение батареи, В |
Battery voltage, V |
|
Ток батареи, А |
Battery current, A |
|
Состояние заряда, % |
Charge condition, % |
The obtained diagrams show the common trends. Also, curves both in REPIT software and in operation [2] change in similar ranges with small deviations.
Thus, based on the obtained results, it can be concluded that results of lithium-ion battery simulation in REPIT software are reliable both in static and dynamic modes.
References
-
Panasonic NCR-18650B battery passport specification https://www.imrbatteries.com/content/panasonic_ncr18650b-2.pdf
-
Article Tremblay O. Experimental Validation of a Battery Dynamic Model for EV Applications // World Electric Vehicle Journal. – 2009. – Vol. 3, no. 2. – P. 289-298. DOI: 10.3390/wevj3020289