Closed switchgears (CSG) are used to supply power to urban and industrial facilities. These devices are complex electrical systems and it is always required to select the equipment specifications to match the operating mode for design purposes. Mathematical modeling is the best and most effective way of selection. REPEAT software as a model-oriented design and mathematical modeling environment successfully copes with the task of creating switchgear digital models. This article describes the simulation of CSG steady-state operation using REPEAT software.
Introductory information for model building
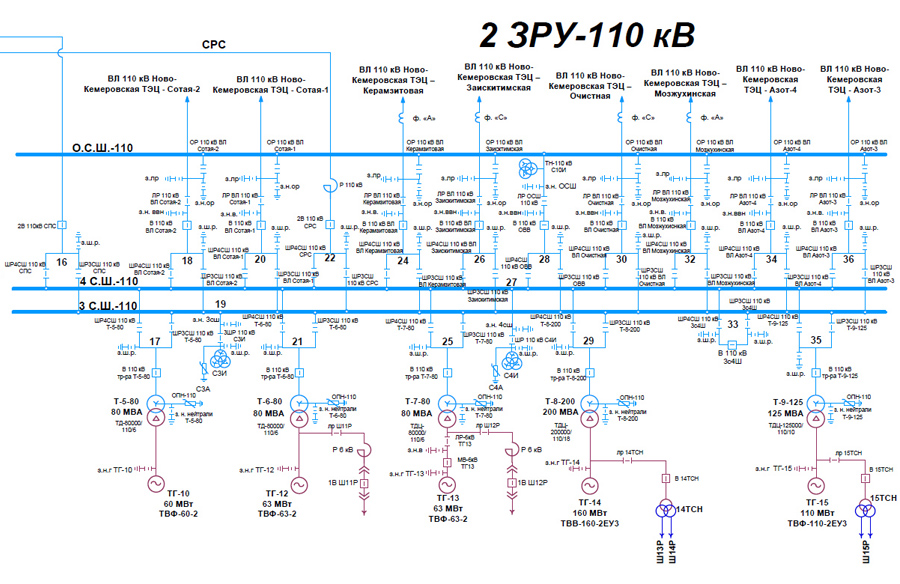
A 110 kV switchgear is selected as a simulation object. This CSG consists of three busbars (3 S.Sh-110 and 4 S.Sh-110, respectively), as well as a bypass busbar O.S.Sh-110), five generator-transformer units and other electrical equipment (circuit breakers, disconnectors, current-limiting reactors, earthing switches, as well as measuring voltage transformers). Normal circuit diagram of this CSG is shown in Figure 1.
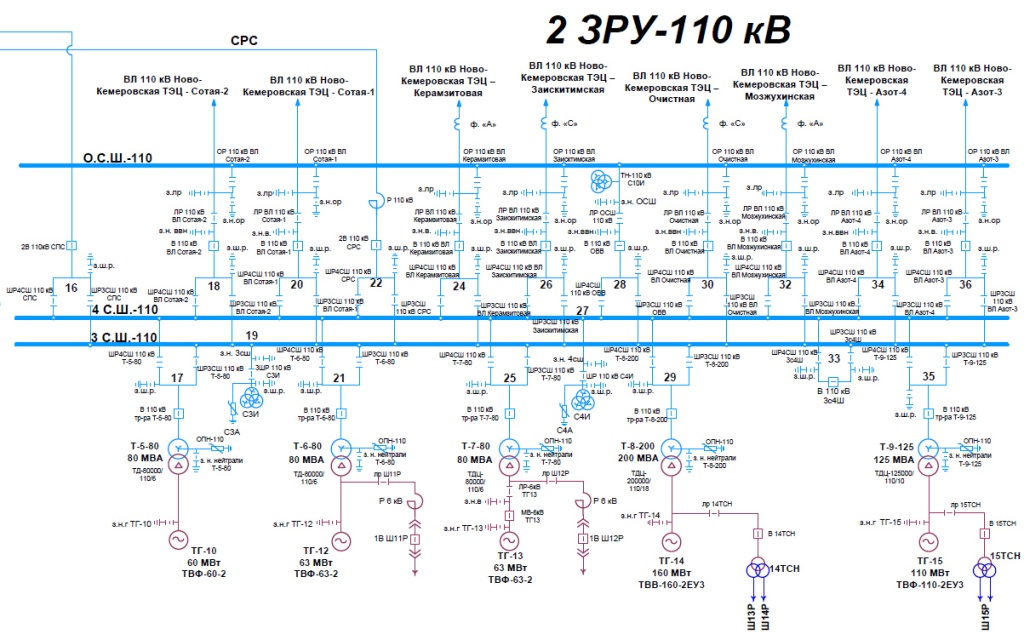
Figure 1. The normal circuit diagram of the simulated CSG
For steady-state mode simulation it is, however, sufficient to consider only the busbars, generator-transformer units and the load, disregarding the simulation of other electrical equipment, as it has no influence on the steady-state mode. Parameters of generators and transformers are given in Table 1, generators – p.211, transformers – p.244].
Table 1. Equipment parameters
|
Generators |
||||||||||||||||||
|
Type |
|
|
|
|
|
|
|
|
|
|
|
SCR |
|
|
||||
|
MW |
- |
MVAr |
kV |
% |
% |
% |
% |
% |
% |
% |
- |
|
s. |
|||||
|
TVF-60-2 |
60 |
0.8 |
45 |
6.3 |
98.5 |
19.5 |
28 |
161 |
12.1 |
23.8 |
9.2 |
0.64 |
8.85 |
4.9 |
||||
|
TVF-63-2 |
63 |
0.8 |
47 |
6.3 |
98.3 |
18 |
27.5 |
192 |
12.1 |
22 |
9.2 |
0.537 |
9.7 |
6.1 |
||||
|
TVF-100-2 |
100 |
0.8 |
75 |
10.5 |
98.4 |
19.1 |
27.8 |
192 |
16.7 |
23.4 |
9.73 |
0.563 |
13 |
6.5 |
||||
|
ТВВ-160-2 |
160 |
0.85 |
102 |
18 |
98.5 |
22.1 |
32.9 |
230 |
16.7 |
26.9 |
11.5 |
0.475 |
13 |
5 |
||||
|
Transformers |
||||||||||||||||||
|
Type |
|
Voltage control |
|
|
|
|
|
|||||||||||
|
MVA |
kV |
% |
kW |
kW |
% |
|||||||||||||
|
HV |
LV |
|||||||||||||||||
|
TDTs-80000/110/6 |
80 |
|
121 |
6.3 |
10.5 |
310 |
70 |
0.6 |
||||||||||
|
TDTs-200000/110/18 |
200 |
|
121 |
18 |
10.5 |
400 |
120 |
0.55 |
||||||||||
|
TDTs-125000/110/10 |
125 |
|
121 |
10.5 |
10.5 |
550 |
170 |
0.5 |
||||||||||
|
TRDNS – 25000/35 |
25 |
|
36.75 |
6.3-6.3 |
9.5 |
115 |
25 |
0.5 |
||||||||||
|
TRDNS – 25000/18 |
25 |
|
36.75 |
6.3-6.3 |
9.5 |
115 |
25 |
0.5 |
||||||||||
Calculations and model building
An image of the mathematical model implemented in REPEAT software is shown in Figure 2.
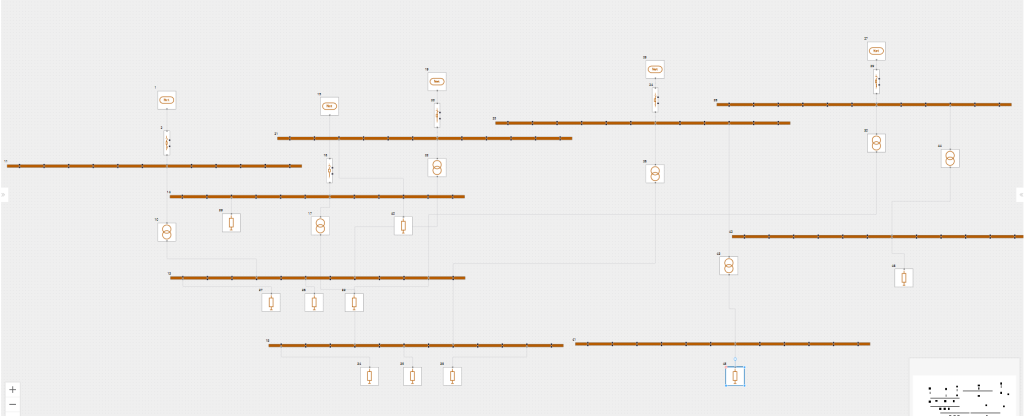
Figure 2. Mathematical model implemented in REPEAT software
The generators are simulated by voltage source units capable of producing infinite power. The parameters of these sources are voltage (set equal to the rated voltage of the corresponding generator) and frequency (set equal to 50 Hz industrial frequency).
Transformers are simulated by a double-winding transformer unit, which simulates the operation of a real transformer according to a simplified substitution diagram without taking into account the influence of magnetization branch (the unit parameters in this case are power, transformation ratio, side voltage (higher voltage or HV), voltage and short-circuit (SC) losses of the transformer). It is important to note that the input signal of this unit is the HV winding voltage. Therefore, the output signal will be the input signal (minus the voltage losses in transformer windings) multiplied by the transformation ratio. I.e. for a transformer to operate as a step-up transformer, the transformation ratio should be specified as ![]() . And vice versa for a step-down transformer.
. And vice versa for a step-down transformer.
The own needs of the power plant as well as the CSG total load are simulated by static load units. The parameters of this unit are the rated voltage and the values of active and reactive powers. The auxiliary load is taken as equal to 10% of the generator capacity of the connection unit. Load values are given in Table 2.
Table 2. Data on system loads
|
Load unit No. |
Load type |
Connection point |
Load rate |
Rated load voltage |
|
MVA |
kV |
|||
|
39 |
Auxiliaries |
Output of generator TG-12 (U14) |
|
6.3 |
|
40 |
Auxiliaries |
Output of generator TG-13 (U21) |
|
6.3 |
|
37 |
Total load |
3 S.Sh. (U13) |
|
121.0 |
|
38 |
Total load |
3 S.Sh. (U13) |
|
121.0 |
|
33 |
Total load |
3 S.Sh. (U13) |
|
121.0 |
|
34 |
Total load |
4 S.Sh. (U18) |
|
121.0 |
|
35 |
Total load |
4 S.Sh. (U18) |
|
121.0 |
|
36 |
Total load |
4 S.Sh. (U18) |
|
121.0 |
|
45 |
Auxiliaries |
Auxiliary transformer 14 AT of generator unit TG14 (U41) |
|
6.3 |
|
46 |
Auxiliaries |
Auxiliary transformer 15 AT of generator unit TG15 (U42) |
|
6.3 |
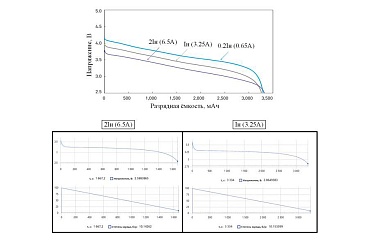
The voltages in the load nodes (node is a corresponding numbered “Busbar” unit) are given in the graphs shown in Figure 3, Figure 4, Figure 5, Figure 6, Figure 7 and Figure 8.
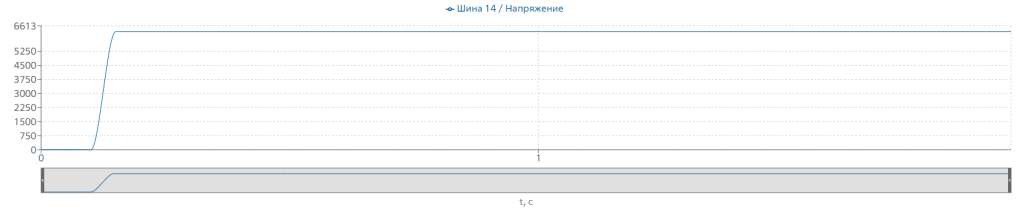
Figure 3. Voltage in unit 14
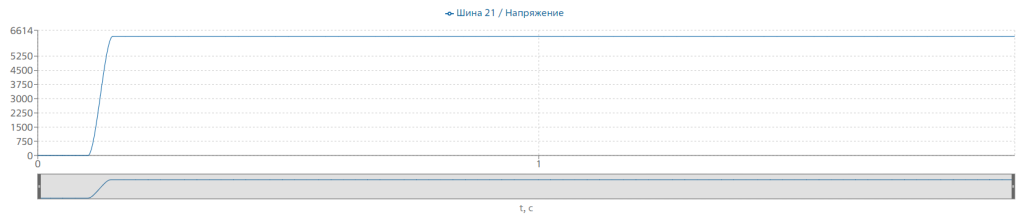
Figure 4. Voltage in unit 21
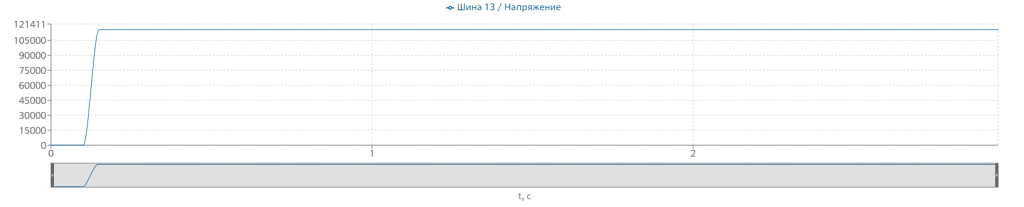
Figure 5. Voltage in unit 13
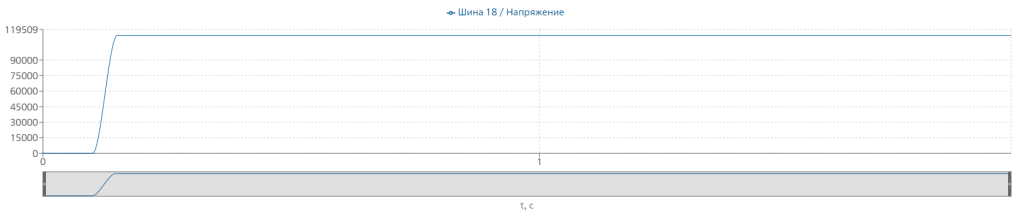
Figure 6. Voltage in unit 18
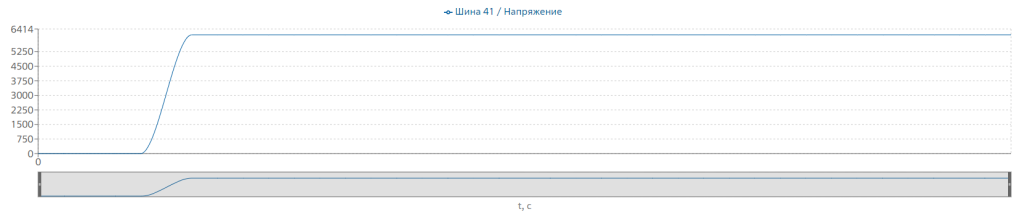
Figure 7. Voltage in unit 41
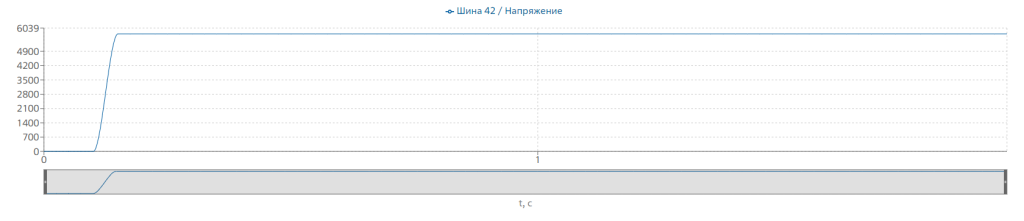
Figure 8. Voltage in unit 42
It is necessary to analyze the deviations of voltages in the load nodes and assess them in terms of requirements for quality of electricity, established by GOST 32144-2013. In accordance with them, “positive and negative voltage deviations should not exceed 10% of the rated or agreed voltage value. Voltage deviation can be calculated using the following formula:
![]()
Where ![]() is a agreed or rated voltage of the node (kV),
is a agreed or rated voltage of the node (kV), ![]() - is a design (real) voltage in the node (kV). Deviation calculation results are given in Table 3.
- is a design (real) voltage in the node (kV). Deviation calculation results are given in Table 3.
Table 3. Stress deviations in load nodes
|
Node |
|
|
|
Compliance with quality |
|
kV |
kV |
% |
||
|
13 |
121 |
115.62898 |
4.44% |
+ |
|
14 |
6.3 |
6.29810 |
0.03% |
+ |
|
18 |
121 |
113.81782 |
5.94% |
+ |
|
21 |
6.3 |
6.29881 |
0.02% |
+ |
|
41 |
6.3 |
6.10847 |
3.04% |
+ |
|
42 |
6.3 |
5.75110 |
8.71% |
+ |
Results of 110 kV switchgear simulation
As a result, the design voltages of all of the above-named nodes when simulating in REPEAT software meet the requirements for power quality, according to GOST 32144-2013. This result allows to safely use REPEAT software for high-quality simulation of CSG steady-state operating modes and recommend the software for industrial use in design of power facilities.
References
- Handbook on design of power grids/ ed. by D. L. Faibisovich – 4th edition, revised and supplemented. – М.: ENAS, 2012. – 376 p.: ill.